Animations with Plots.jl
Animations tell a story that static images are unable to tell by adding an extra dimension (often time). They are also more engaging to an audience...

Enjoying Julia For Data Science? Please share us with a friend and follow us on Twitter at @JuliaForDataSci.
Why Animations are Great
The ability to communicate results is an under-appreciated skill in data science. An important analysis can be unheard or misunderstood if it's not presented well. Let's borrow the model for data science projects proposed by R for Data Science, in which Communicate is the final step.

Animations tell a story that static images are unable to tell by adding an extra dimension (often time). They are also more engaging to an audience (here is one of many social marketing blogs on the topic of engagement from video vs. static images). Getting your audience to pay attention is a part of communicating your results, so animations are a great tool.
Animations with Plots.jl
Plots.jl is a Julia package that provides a unified syntax for multiple plotting backends. It also provides some super simple and powerful utilities for creating animations in the gif format. There are several ways to create animations in Plots, with varying levels of complexity. We recommend using Pluto (see our Pluto introduction here) to make Plots animations because they'll appear in the notebook.
The simplest way is the @gif macro.
- Place
@gifin front of a for loop that generates a plot in each iteration. Each plot will be saved as a single frame in the animation.
using Plots

@gif for i in 1:50
    plot(sin, 0, i * 2pi / 10)
end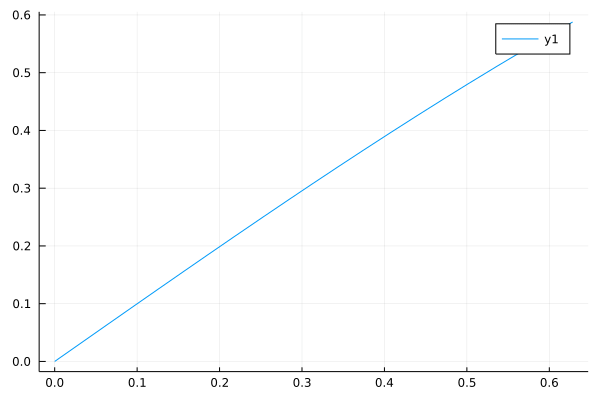
- You can add "flags" such as
every nto only save a frame everynimages. orwhen <condition>to only save certain frames.
@gif for i in 1:50
    plot(sin, 0, i * 2pi / 10)
end when i > 30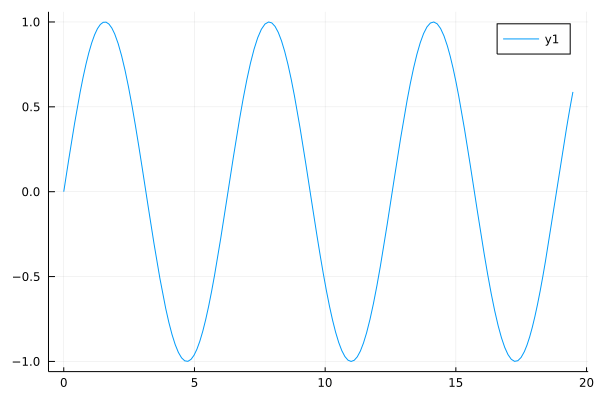
To control frames-per-second, use @animate.
- Works just like
@gif, but creates aPlots.Animationrather than a gif directly.
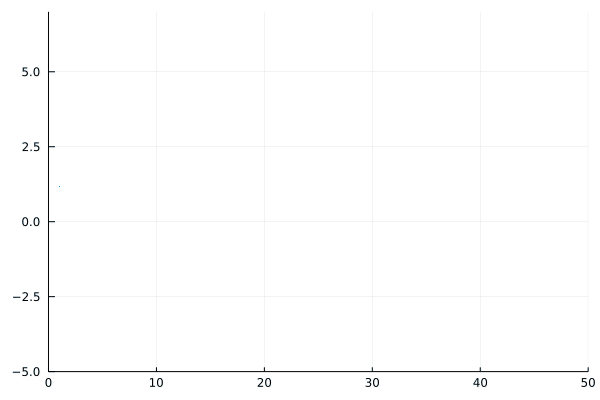
anim = @animate for i in 1:50
    Random.seed!(123)
    scatter(cumsum(randn(i)), ms=i, lab="", alpha = 1 - i/50,
        xlim=(0,50), ylim=(-5, 7))
end- You can then use the
giffunction on yourAnimation.
gif(anim, fps=50)
For the most control, use Plots.Animation directly.
- Save each frame explicitly with
frame.
a = Animation()

for i in 1:10
    plt = bar(1:i, ylim=(0,10), xlim=(0,10), lab="")
    frame(a, plt)
end

gif(a)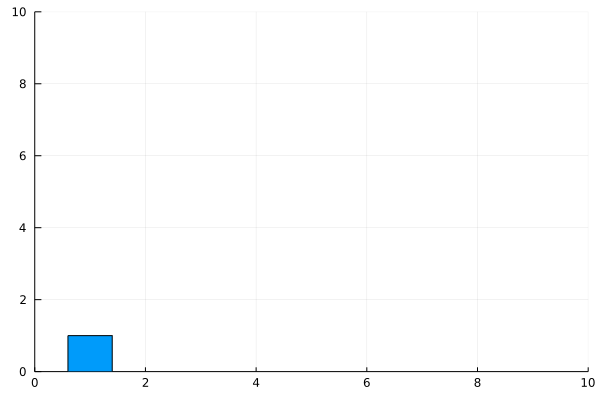
🚀 That's It!
You now know how to make some cool animations with Julia and Plots.jl.
Enjoying Julia For Data Science? Please share us with a friend and follow us on Twitter at @JuliaForDataSci.